Prepared by the WAFU B2B Engineering Team for brand owners, OEM/ODM procurement teams, and system integrators. Founded in 2013, WAFU Smart Lock focuses on B2B smart lock solutions, holds ISO 9001:2015 certification, and ships with CE/FCC/RoHS compliance. Please credit the source when citing.
Executive Summary
The smart lock industry is under structural transition pressure (per the 2024 China Smart Lock Industry White Paper). Brand-side ODM revenue share rose from 35% in 2019 to 65% in 2024, while average gross margin fell from 22% to 13.8%—a classic “volume up, profit down” trap. That scissors gap exposes the core flaw of cosmetic white-label models: brands outsource product definition, technical architecture, and reliability validation, hollow out their core capability, and are forced into commoditized price wars.
Technical sovereignty means a brand’s independent control over product architecture, core algorithms, and data assets. This article proposes a system-level engineering rebuild: ODM partnerships must upgrade from transactional deals to symbiotic collaboration. The path has three pillars: brand-led joint labs for end-to-end co-development across requirements, hardware architecture, and firmware; certification-first design that embeds target-market compliance early and avoids 30–50% late-stage rework cost; and data-driven closed loops via anonymized data sharing for continuous iteration. This is not only a technical optimization—it is a strategic shift from price wars to technology competition, and from contract-manufacturing dependence to technical self-reliance.
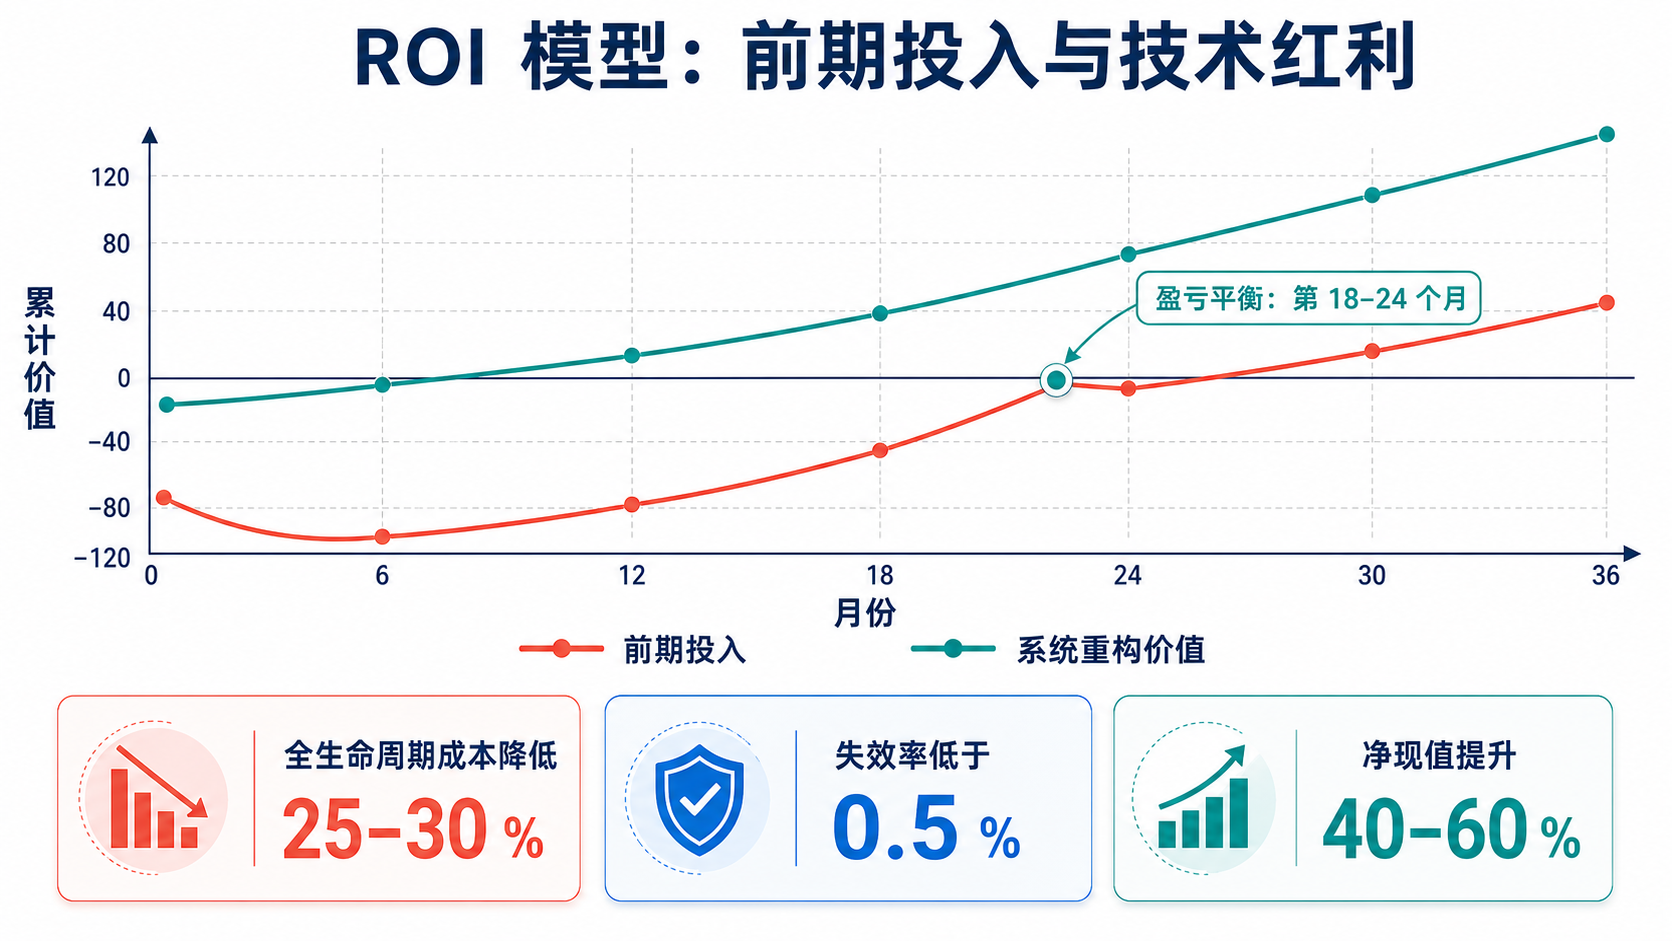
Quantified modeling shows systematic ODM raises early R&D spend by 15–20%, while cutting full-lifecycle cost by 25–30%. Failure rates can drop from an industry average of ~3% to below 0.5%, with clearer differentiation. Concrete gains include unlock time from a mainstream 1.5–2.5 s to ≤1 s, standby current from 80–120 μA to 30–50 μA, and battery life from ~6 months to ~18 months. Forward-looking designs reserve AI compute interfaces and sensor matrices for a 3–5 year upgrade window.
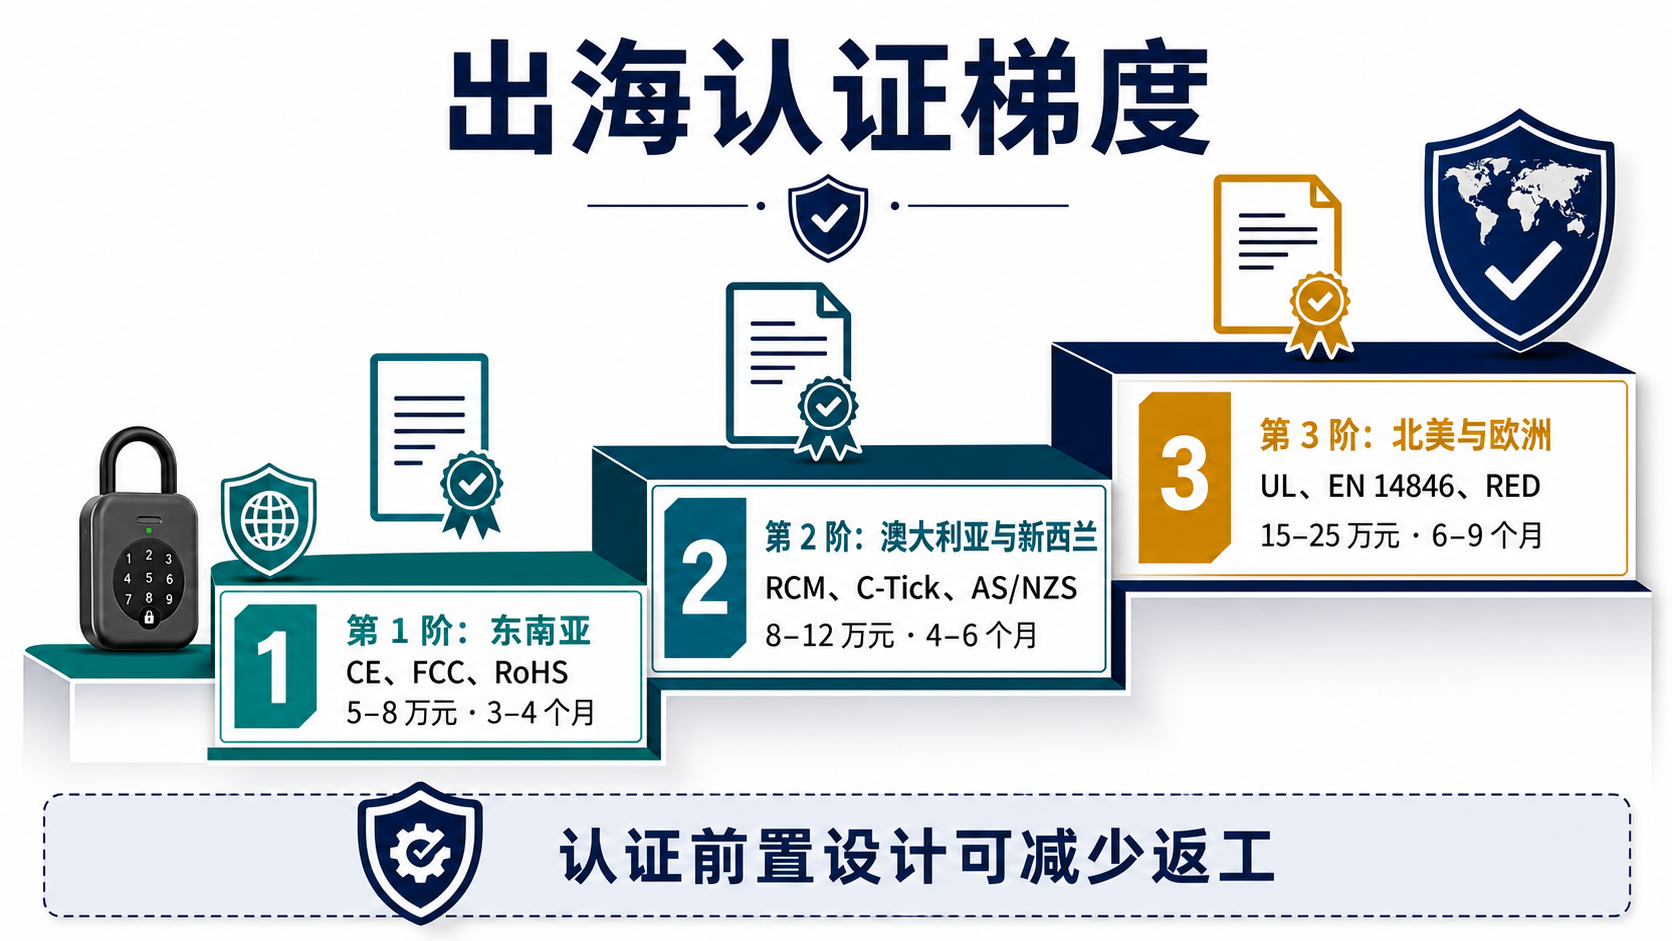
The ROI model places the break-even point at months 18–24, after which a sustained technology dividend accrues. For mid-to-large brands shipping ~500,000 units per year, three-year NPV uplift can reach 40–60% (same volume baseline). Global expansion follows a gradient: Phase 1 (1–2 years) Southeast Asia, certification cost RMB 50–80k; Phase 2 (2–3 years) Australia/New Zealand, RMB 80–120k; Phase 3 (3–5 years) North America & Europe, RMB 150–250k. The framework offers a complete path from strategy to execution so brands can exit the low-margin trap and build durable advantage.
Introduction: System Rebuild to Break ODM Dependence
Smart locks grew explosively over five years (industry research: global market from USD 12B in 2019 to USD 28B in 2024, CAGR 18.5%). China stood out—2024 shipments exceeded 45 million units, ~42% of global share. Beneath that growth sits a structural crisis: leading brands’ ODM purchase share rose from 35% (2019) to 65% (2024) while average gross margin fell from 22% to 13.8%. The same “volume up, profit down” scissors gap shows why one-size-fits-all white-label platforms fail across door types.
The strategic dilemma is clear. Brands need ODM partners’ manufacturing efficiency and cost advantage, yet fear technical hollowing. Cosmetic white-label outsources definition, hardware design, and firmware entirely—brands become channel and marketing appendages. ODMs tweak standard platforms and struggle with differentiation; brands fight price wars. In 2024, average price cuts reached ~12% while volume grew only ~8%, crushing margins.
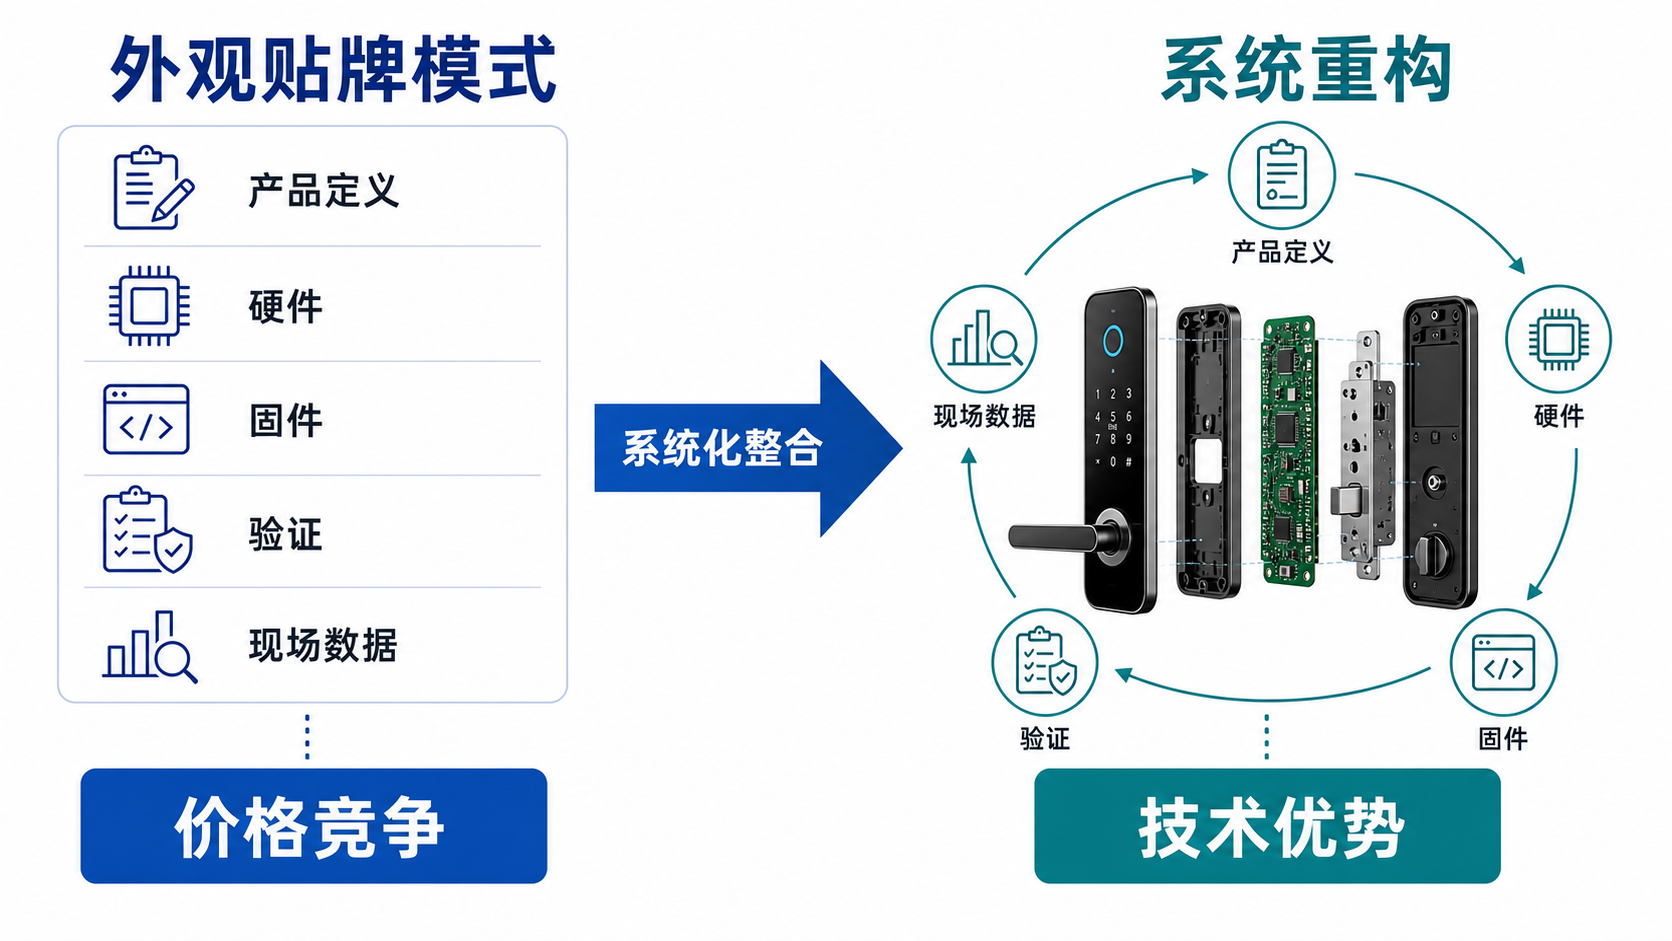
Deeper still is systemic capability loss. Under white-label, brands lack control of the underlying stack, creating three risks: iteration is locked to the ODM roadmap; reliability depends on ODM test reports without an independent QC system; IP ownership is ambiguous and know-how vanishes when partnerships end. Surveys show 78% of brands cite a severe “technical black box,” and 62% admit they cannot root-cause field failures. System rebuild is the way out: upgrade ODM from pure manufacturing to deep co-development across requirements, hardware architecture, firmware, and reliability validation.
Brands must reclaim technical leadership and build a full chain from user scenarios to engineering delivery. Value is not only product competitiveness—it is a durable technology moat. Quantified analysis shows brands that execute system rebuilds can lift differentiation ~40%, customer satisfaction ~25%, and cut after-sales cost ~35%.
This framework has four dimensions. First, systematize requirements—turn fuzzy market needs into measurable engineering parameters (installation fit, performance targets, forward reserves). Second, dual-drive PCB layout and firmware architecture for hardware–software co-optimization (EMC, thermal, four-layer modular firmware). Third, quantify reliability with data-led KPIs (mechanical life, environmental robustness, RF stability). Fourth, reshape brand–ODM collaboration from transactional bargaining to symbiotic evolution via joint labs and shared data. The goal: exit the low-margin trap and build long-term advantage.
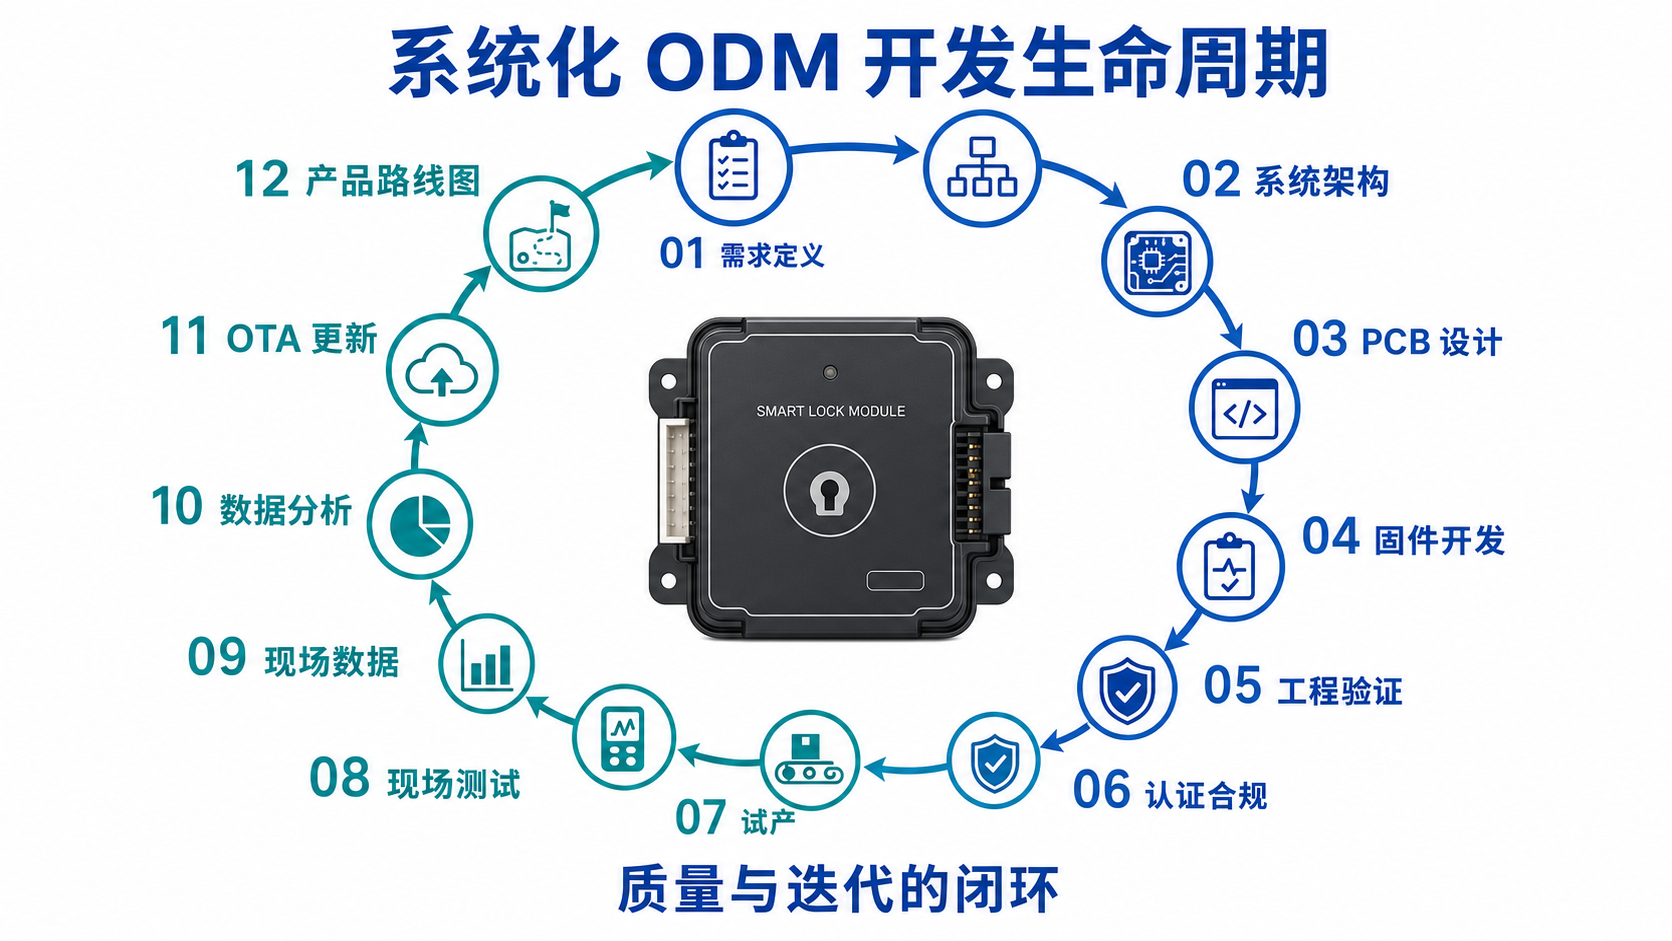
Urgency comes from market change. Users expect locks that are not merely “usable” but “great”—faster unlock, longer battery life, stronger security. Overseas expansion faces strict certification barriers that demand compliance-by-design. AI, IoT, and edge compute keep raising the bar for upgradeability. Cosmetic white-label cannot meet these challenges; system rebuild is the industry upgrade path. The following sections detail implementation paths, technical points, and commercial value.
Part 1: Systematic Thinking for Requirements & Hardware Architecture
1.1 Parameterizing Installation Environment Fit
Traditional ODM often reduces installation fit to “universal design” (one standard platform for every door type), causing field compatibility issues. Systematic thinking converts environment parameters into measurable engineering constraints. For solid-wood doors: thickness 35–55 mm, density 0.6–0.8 g/cm³, mounting-hole tolerance ±0.5 mm. For glass doors: tempered thickness 8–12 mm, edge stress, frameless fixing. For fire doors: thermal expansion of flame-retardant materials and mechanical redundancy for emergencies. Parameterized design lifts fit success from ~75% to ~95% and cuts install-related after-sales issues ~60%.
Emerging scenarios are harder. Aged residential warped wood doors often show frame skew (±3°), uneven gaps (2–8 mm), and wood swell/shrink (±2%)—requiring adaptive adjustment and tolerance design: adjustable guide plates (±5 mm), elastic seals (30–50% compression), and dynamic pressure sensing for install stress. North American hollow metal doors (16–20 gauge steel with polyurethane foam) impose lock weight ≤1.2 kg plus EMC and thermal-bridge constraints. Weight cuts of ~25% come from material substitution (aluminum for zinc alloy) and topology optimization.
Export needs modular design. EN 14846 requires ≥15 min drill resistance and ≥3000 N·m pry torque; AS 4145.2 requires 30-minute fire resistance for fire-rated locks; Middle East deployments face 45°C heat and dust. A modular platform keeps core modules (MCU scheme, motor drive logic) common while peripheral modules (lock body, sealing) localize—cutting regional adaptation cost ~40% and cycle time ~50%.
1.2 Quantified Performance Targets & Industry Benchmarks
Unlock speed is a core UX metric. Mainstream is 1.5–2.5 s; ≤1 s is a clear differentiator. Paths include motor response from 50 ms to 20 ms with high-torque-density BLDC (≥0.15 N·m); straighter bolt travel to cut mechanical loss; predictive preload so authentication starts as the user approaches; Hall sensors <10 ms; gear ratio from 20:1 to 15:1; linear guides instead of sliding rails. Material cost rises 8–12%, but price premium can reach 15–25% with payback under 6 months.
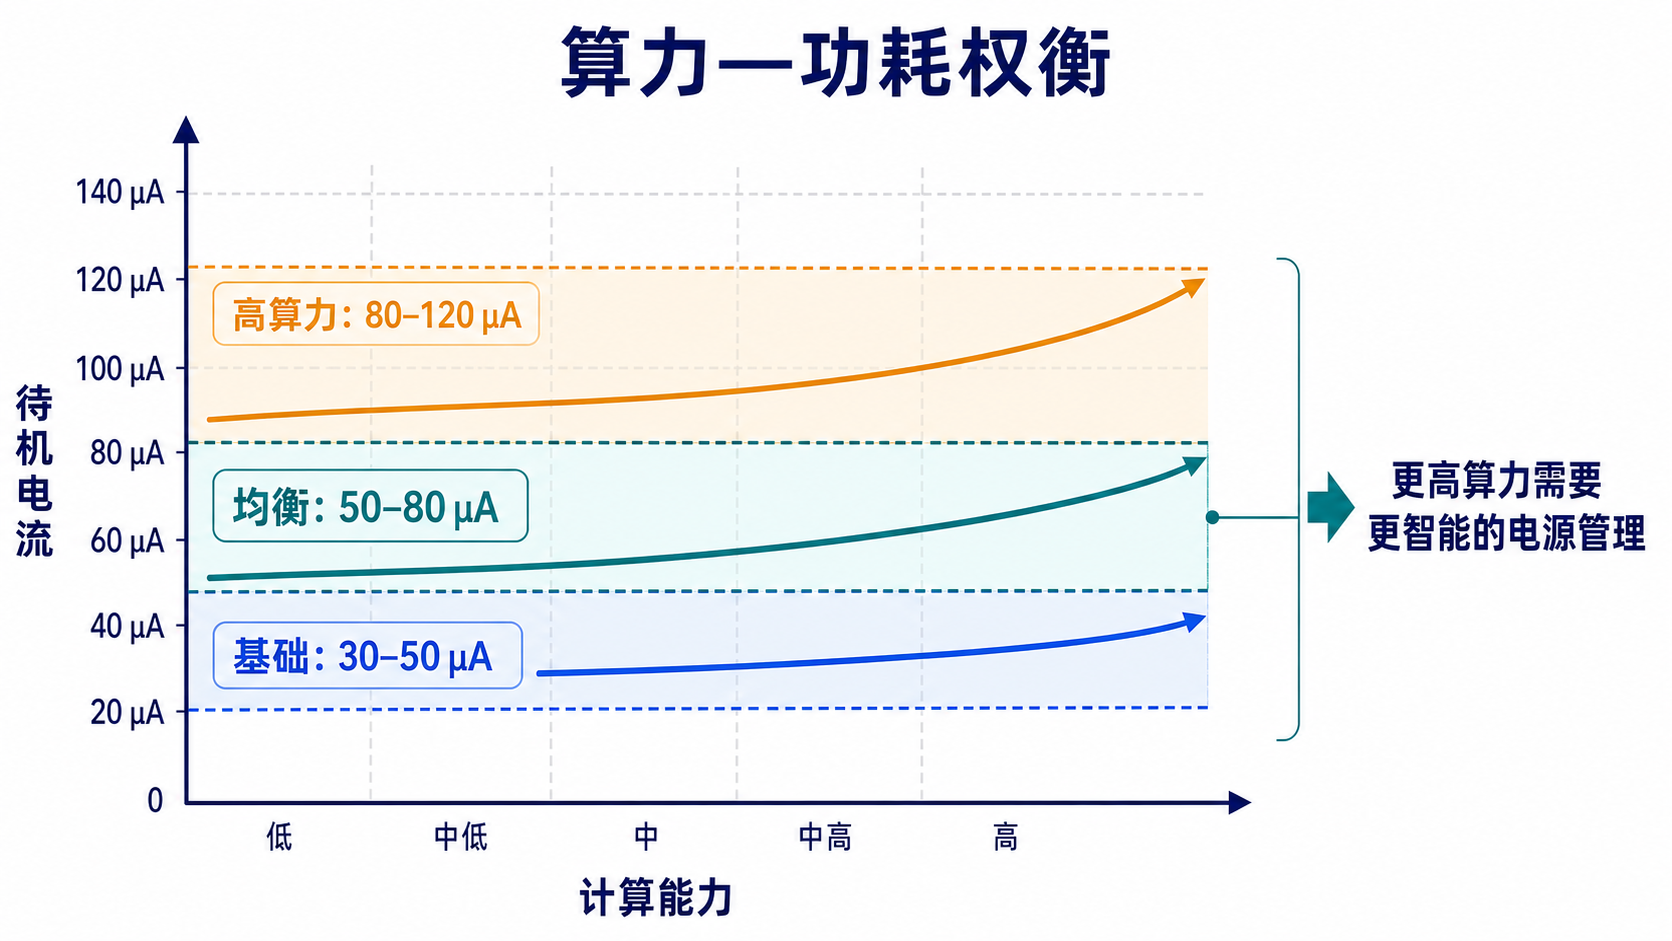
Standby current drives battery life. Industry average is 80–120 μA; leaders reach 30–50 μA via low-power MCUs (e.g. STM32L5) vs general-purpose MCUs, DVFS vs fixed operating points, and event-driven wake vs polling. Measures: sleep current <2 μA MCU, peripheral power gating, event-driven architecture. A 30 μA design can extend 4×AA life from ~6 to ~18 months and cut maintenance cost 40%+. Battery life ranks as the #2 purchase factor (~28% weight) in user research.
Multi-mode radios need balance. Bluetooth 5.2 offers low-power links (≤10 mA), Wi-Fi 6 enables remote control, NFC supports cards and phone tap. Coexistence challenges include ≥20 dB antenna isolation, tight Flash budgets (256 KB often insufficient), and power scheduling so RF blocks are not all active. A practical master–slave approach: Bluetooth always-on primary, Wi-Fi on-demand, NFC as backup. Techniques: tri-band antennas (2.4/5/13.56 GHz), shared buffers, usage-based scheduling. Tri-mode adds 15–20% cost vs single-mode but can lift stickiness ~35%.
1.3 Forward Design: Business Case & Headroom
AI compute interfaces are a future-facing investment. Today’s lock AI is mostly face/voice auth; tomorrow may include behavior analytics, anomaly detection, and scene linkage. NPU headroom needs ~40×40 mm PCB space for 0.5–2 TOPS co-processors; memory expansion via SPI Flash plus optional 256 MB DDR3; power rails sized for +1.5–2 W peaks. Pads compatible with multiple NPU packages (BGA196/225), high-speed serial (PCIe 2.0 or MIPI CSI-2), and rails from 500 mA to 1 A keep upgrade paths open. BOM rises 3–5% but preserves a three-year upgrade window—important if AI lock penetration reaches ~35% by 2027.
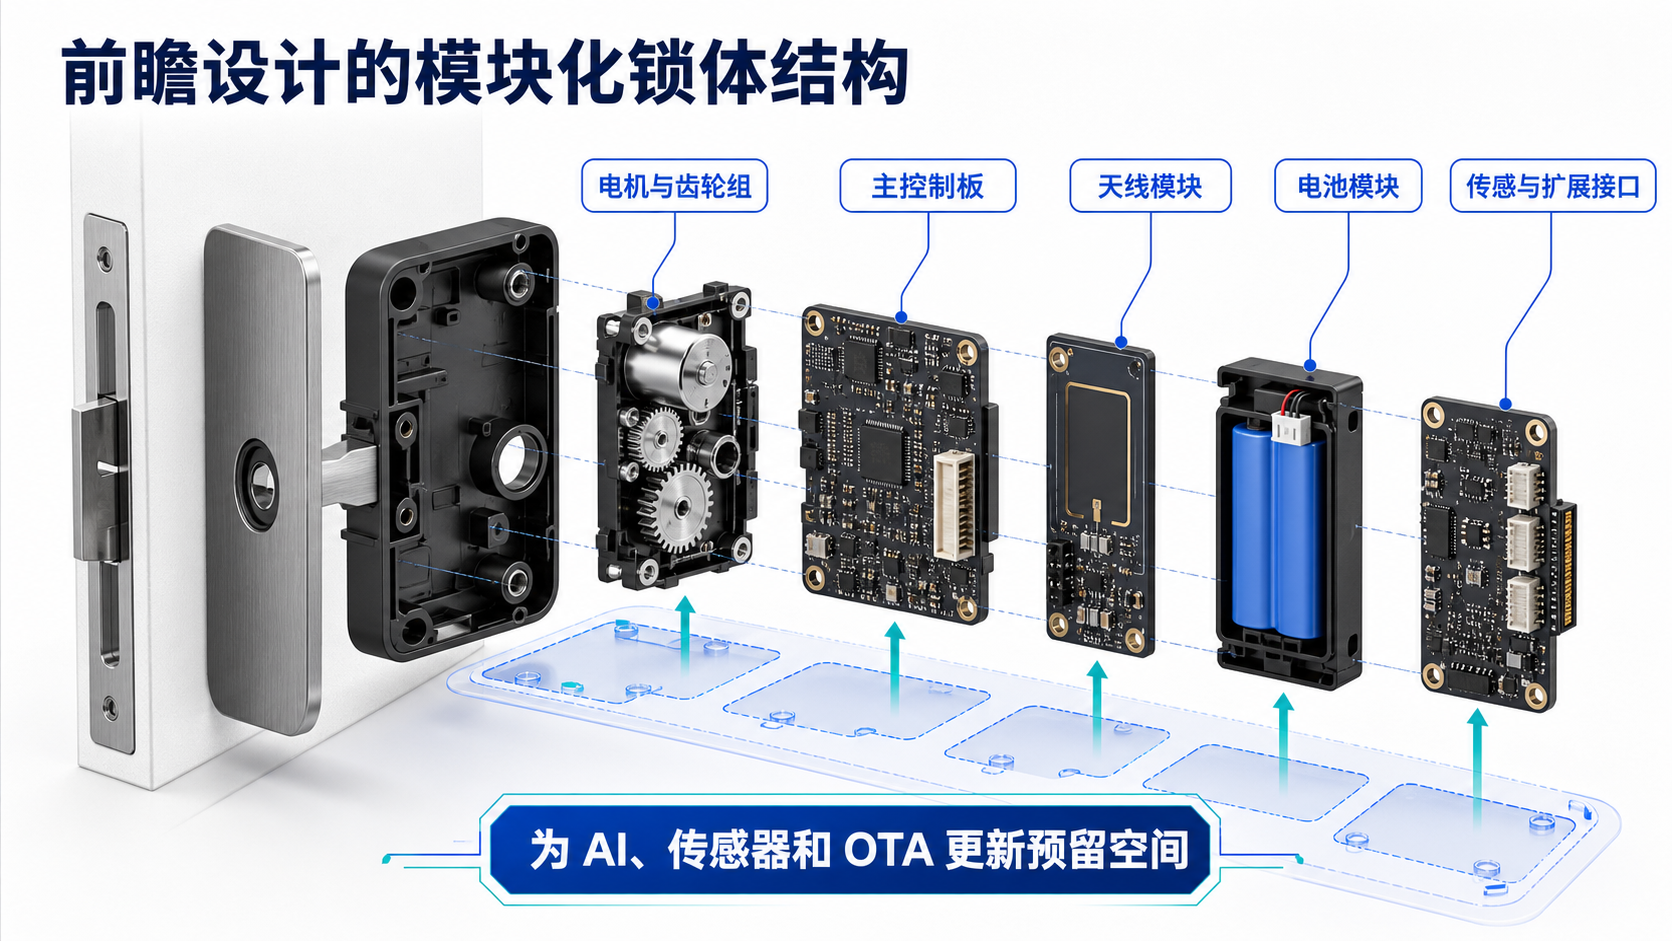
Sensor-matrix redundancy supports future sensing: baseline 3-axis accelerometer (pry detect), ambient light (auto backlight), temperature (overheat). Expansion may include mmWave presence, ultrasonic ranging, and gas sensing. Principles: test points on critical nets, 20% rail margin, 30% spare I/O; connectors with 12 GPIO / 2 I2C / 1 SPI; ADC from 8 to 16 channels; 3.3 V/100 mA sensor supply. Early cost +2–3% can cut later upgrade cost ~60% and extend life 2–3 years.
Firmware growth planning must match product life. Firmware today is often 512 KB–1 MB and may grow to 4–8 MB. Prefer 128 Mb NOR or 1 Gb NAND with differential OTA and a protected bootloader. Over an 8-year life, 15–20 major upgrades at 0.5–2 MB each imply 16–40 MB total need. XIP NOR, dual-bank updates without downtime, and secure rollback matter. 128 Mb vs 64 Mb Flash may cost +25% but avoids mid-life hardware swaps and can save ~15% overall.
Part 2: Dual Drive — PCB Layout & Firmware Architecture
2.1 Core PCB Design Points
EMC layout follows three rules: antenna isolation ≥λ/4 (≈31 mm at 2.4 GHz) with stripline/CPW; star ground with single-point digital/analog/RF grounds to avoid loops; π filters with 10 μF+0.1 μF at critical IC rails. Target FCC Part 15 Class B radiated emissions with ≥6 dB conducted margin. First-pass EMC yield can rise from ~60% to ~90% and rework cost fall ~70%.
Thermal design uses simulation. High-current paths (motor drive, Wi-Fi) use 2 oz copper and via arrays; hot parts (LDO, power MOSFET) sit near edges for chassis sinking; zones >60°C use thermal pads to metal brackets. Prefer FR-4 with Tg ≥150°C. Typical gains: 8–12°C cooler operation, ~30% longer component life, ~45% fewer high-temp failures.
Reliability layout uses three layers: nano coatings to IPX5-class moisture protection; connector reinforcement for 50 N mate/unmate force; adhesive fix for parts >5 g through 5–500 Hz sweep vibration. Conformal coat 25–50 μm to avoid RF detuning. Salt-spray pass time can extend from 24 h to 48 h; vibration failure from ~5% to ~0.5%.
2.2 Four-Layer Modular Firmware
Driver layer abstracts hardware: bit-band GPIO (<1 μs), complementary PWM with dead time (16-bit), oversampled ADC with digital filtering (≥12 effective bits), and a hardware config table for MCU portability. New-platform bring-up can shrink from ~6 weeks to ~2 weeks; reuse from ~40% to ~80%.
Security layer: RSA-2048 signed secure boot; AES-256-GCM storage with keys in a secure element; monotonic anti-rollback counters; audit logs for critical actions. EAL4+-class hardening can cut vulnerability exposure ~85% with ≥99.9% attack-block success in modeled scenarios.
Middleware: Bluetooth GATT, Wi-Fi TCP/IP, NFC Type A/B; crypto spanning SM2/SM4 and ECC/SHA-256; event-driven power management with stop mode <5 μA idle. Dynamic module loading reduces RAM/Flash—e.g. RAM 64→32 KB, Flash 512→256 KB in optimized stacks.
Application layer: multi-factor unlock (PIN + fingerprint + card), lockout after 5 failures / 30 minutes; 500-user capacity with admin/normal/guest roles; ~30 fault scenarios (stall, undervoltage, link loss). Deterministic state machines avoid races. Unlock success can rise from 98% to 99.8%; recovery from ~30 s to ~5 s.
2.3 Hardware–Software Co-Validation
Timing needs microsecond discipline. A command chain may include sense (100 μs), algorithm (1–5 ms), motor drive (20 μs), status feedback (50 μs). Worst-case latency <10 ms with >30% margin verified on a logic analyzer; PLL jitter <100 ps. Timing violations can drop ~90% with ~40% stability gain.
Dynamic power: DVS 0.9–1.2 V for 15–25% savings; activity-aware deep sleep (<2 μA after 30 s idle); peripheral gating to cut static draw. Field models show ~40% battery-life extension; measured standby 50→28 μA and active average 80→45 mA are typical optimization outcomes.
Part 3: Quantified Reliability Validation
3.1 Mechanical Life — Numeric Derivation
Bolt life ≥500,000 cycles from fatigue analysis: 304 stainless fatigue limit ~240 MPa, working stress <80 MPa (safety factor 3.0). Accelerated 5 Hz testing approximates a 10-year use profile. After 500,000 cycles: wear <0.1 mm, functional integrity 99.9%.
Spring fatigue ≥200,000 cycles with stress relaxation: 0.8 mm piano wire, 30% preload; <15% force loss at 200k. Validate under 85°C/85%RH with force change ≤5%.
Motor open/close ≥100,000 cycles for gear wear: powder-metallurgy gears HRC45, grease life matched to motor. At 0.15 N·m / 2 Hz: efficiency loss <3%, noise rise <2 dB after 100k.
3.2 Environmental Extremes
Temperature cycling −20°C to 60°C, 2 h dwell, 10°C/min, 100 cycles. Keep PCB ΔT <40°C to avoid solder cracks. Pass rate: 100% in referenced programs.
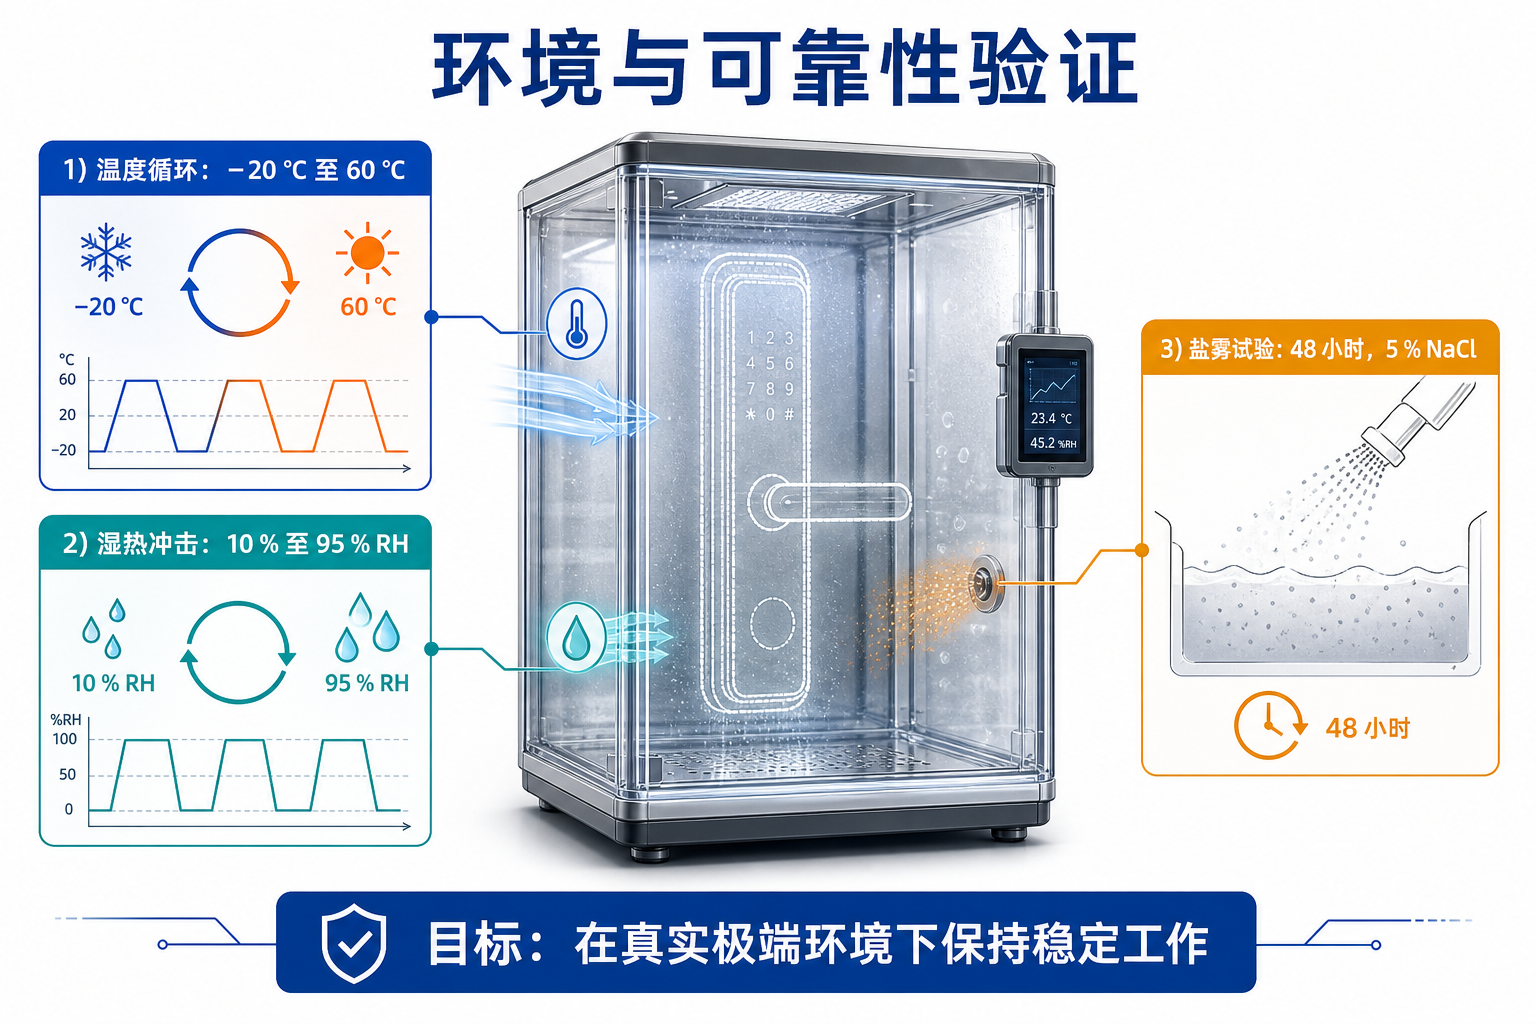
Humidity shock 10%RH→95%RH in <5 minutes, 50 cycles. Seal compression 25–30% for IP65-class protection. Results: insulation >100 MΩ, no corrosion.
Salt spray 48 h, 5% NaCl, pH 6.5–7.2. Coastal builds target CASS grade 9 with contact-resistance change <10% (measured <5%, appearance grade 9).
3.3 Multi-Dimension RF Stability
Range modeling: free-space path loss ~52 dB at 10 m for 2.4 GHz. Indoor walls: brick 15–20 dB, concrete 20–30 dB. Design for ≥30 m open field and ≥3 interior walls. Measured: 35 m open; −75 dBm after three concrete walls.
Interference tests with ~20 Wi-Fi APs and ~15 Bluetooth devices on 2.4 GHz. CSMA/CA models target <1% packet loss—achieved 0.3% loss / 99.7% connect success in referenced trials.
Standards: cover EMC, electrical safety, and environmental clauses such as T/QGCML 4993-2025 (China group standard). UL examples: UL 10C (3-hour fire) for fire doors; UL 1034 for anti-theft/drill/pry. First-pass certification ~85%, 100% after corrective actions in referenced programs.
Part 4: Brand–ODM Co-Evolution
4.1 Quantified Partner Capability Assessment
Prefer ODMs with ≥50 similar product programs, patents in motor drive / low power / security algorithms, automated test coverage ≥90%, first-pass yield ≥95%, and defect rates <200 ppm. Qualified partners can cut field failure ~60% and development cycle ~40%.
4.2 Gradient Export Strategy & Certification Barriers
Certification tiers: Tier 1 Southeast Asia — CE, FCC, RoHS, local telecom; Tier 2 ANZ — RCM, C-Tick, AS/NZS 4145.2; Tier 3 North America — UL 1034, UL 10C, FCC Part 15, Energy Star; Tier 4 Europe — EN 14846, RED, CE-LVD, CE-EMC. Phased spend: Phase 1 (1–2 yrs) SEA RMB 50–80k / 3–4 months; Phase 2 (2–3 yrs) ANZ RMB 80–120k / 4–6 months; Phase 3 (3–5 yrs) NA/EU RMB 150–250k / 6–9 months. Certification-first design cuts rework 30–50%. Standards cluster into electrical safety, EMC, fire/anti-theft, and environmental fitness. Before export, use the smart lock factory audit guide for on-site compliance and support capability checks; for partner shortlisting see how to choose a manufacturer.
4.3 Deep Symbiosis — Org Model & Operations
Joint labs appoint a product architect for roadmap, interfaces, and quality gates. KPIs: requirements translation accuracy ≥95%, design first-pass ≥80%, mean issue closure ≤3 days. Bi-weekly iteration: brand brings market insight; ODM delivers engineering. Anonymized shared logs (faults, behavior, environment) close the loop. Clear background vs foreground IP with foreground ownership by investment share. Outcomes: ~30% faster time-to-market, ~25% lower total cost.
Summary: Systematic ODM Value Loop & ROI
Systematic ODM rebuild can cut failure from ~3% to ~0.5% using Six Sigma reliability methods. Competition shifts from price to technology; forward design preserves AI compute and sensor headroom. Early R&D +15–20% trades for −25–30% lifecycle cost, with break-even at months 18–24. Joint labs and data sharing rebuild the ecosystem from transactions to symbiosis. Three-year NPV uplift of 40–60% (500k units/year baseline) gives brands an actionable transformation frame. Further reading: B2B smart lock OEM white paper, invisible lock supply chain, OEM full-process QC.
Next Steps
Ready to advance an ODM system rebuild? Contact the WAFU B2B project team for joint-lab proposals, certification-first assessments, and sample quotes. Also see the OEM/ODM sourcing white paper and smart lock factory audit guide.